|
 As you start the journey to becoming a
lean thinker, it won’t be long before the need to develop a data based
reporting system becomes apparent. The concepts and practices that are
collectively known as lean manufacturing are not difficult. In fact,
they are often deceptively simple. But given the demands of managing a
business, it can be challenging to maintain momentum over the long
haul. When your data reporting system supports the lean concepts, it
will be easier for you to stay consistent with lean principles. The
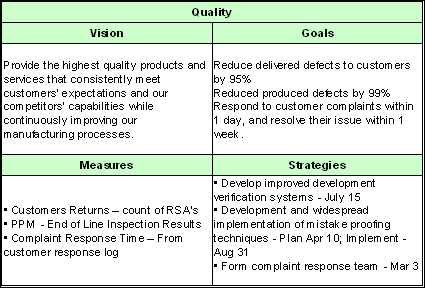
Four Panel approach helps in developing this reporting system. As you start the journey to becoming a
lean thinker, it won’t be long before the need to develop a data based
reporting system becomes apparent. The concepts and practices that are
collectively known as lean manufacturing are not difficult. In fact,
they are often deceptively simple. But given the demands of managing a
business, it can be challenging to maintain momentum over the long
haul. When your data reporting system supports the lean concepts, it
will be easier for you to stay consistent with lean principles. The
Four Panel approach helps in developing this reporting system.
In their white paper
“The Balanced Scorecard – Measures that Drive Performance”, Robert S.
Kaplan and David P. Horton establish the need for a data based
reporting system for managing the critical success factors for a
business. “No single perspective paints a comprehensive picture of a
company’s health. You need an approach that balances several
perspectives and provides measures that enable you to track
performance.” A management reporting system asks you to think of your
company’s mission and strategy from four key perspectives: 1
-
How do customers
see us?
-
At what internal
processes must we excel?
-
How can we
continue to improve and create value?
-
How do we look to
shareholders?2
1. Establish
the Categories for Measurement
We must organize our thinking into a framework to allow managers and
employees to easily identify the critical success factors for the
organization. With this framework established, it becomes easier to
identify what metrics we need to use. Many organizations have so many
metrics in place that management of the information becomes unwieldy.
If you have dozens or even hundreds of metrics, then you need to step
back and revisit your measurement plan, making sure that the critical
success factors are clearly identified.
Typically manufacturing operations use five categories. If you are just
getting started with your data based reporting system, you should start
by using these five categories. They are field tested and effective,
and they cover all four of the perspectives identified by Kaplan and
Horton.
-
Safety –
maintaining a safe workplace
-
People –
development and retention of people who have the skills to deliver to
the customer
-
Quality – meeting
customer, governmental, and internal requirements
-
Responsiveness –
are we responding to the needs of the customer?
-
Financial
Performance – are we making money?
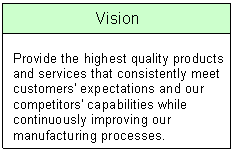 2. Develop the Vision
Statement 2. Develop the Vision
Statement
To make sure your metrics are in fact the critical success factors for
your business, it is necessary to take time to think through exactly
what needs to be accomplished. If you don’t know what success looks
like, you probably won’t recognize it when you see it.
It is important that each of the five categories have a vision
statement. To develop them, brainstorm phrases that succinctly define
the stance you are taking on the category. Use those phrases to create
a statement that clearly communicates to your customers, managers,
employees and stockholders the vision. The statement need not be a
complete sentence; it will be used to develop the goals, measures and
strategy for this category. The vision statement should be established
by the executive team or the corporate operations group and must be
consistent across all manufacturing operations of the company or
division.
 3. Establish Goals 3. Establish Goals
Pull the operations leadership team together and discuss the key
processes that support or drive the vision statement, concentrating on
the “Vital Few” that really make a difference. Establish goals by
determining how the processes need to change or improve to bring them
into alignment with the previously agreed upon vision statement. State
the output of each of these critical processes and identify the level
you would like to obtain.
If your company has multiple facilities, it is critical that the leader
at each facility is included in the team to establish the goals.
Without buy-in from local leadership, it is difficult to implement the
system you are designing.
Process
Examples
|
Safety
OHSA Reporting
Hazard Identification
Ergonomic Management
Near Miss Identification System
|
People
Training
Turnover Management
Skills Assessment
Employee Satisfaction System
|
|
Quality
Defects per Unit (million)
Supplier Quality
Customer Complaint System
Rework / Repair Management
|
Responsiveness
On Time Delivery
Customer Request Management System
Inventory Management
Field Service System
|
|
Financial
Productivity
Warranty Cost Management
Investment Management
Inventory Management
|
|
4. Define the Metrics
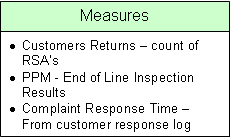 Determine how the performance of the process will
be measured for each goal statement. But think about how you will
collect and manipulate the data - a good measure that is easy to chart
is better than a perfect measure that requires a lot of work. The
methods used to obtain, measure, and calculate data need to be clearly
defined as slight differences can significantly change the reported
results. Determine how the performance of the process will
be measured for each goal statement. But think about how you will
collect and manipulate the data - a good measure that is easy to chart
is better than a perfect measure that requires a lot of work. The
methods used to obtain, measure, and calculate data need to be clearly
defined as slight differences can significantly change the reported
results.
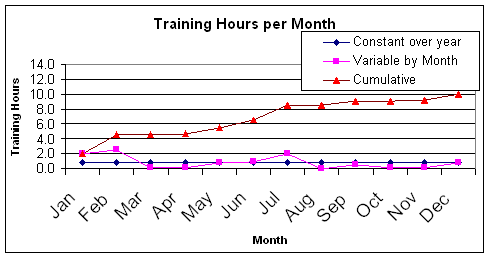
The metrics must be numerical targets. Absolute numerical targets,
ratios or percentages all can be used. The targets can be constant
across the year, variable by month, or they can be cumulative. For
example, we may set a training target for a facility at 10 hours per
associate for the year. But the training plan doesn’t call for the same
number of training hours each month. If the targets aren’t set with
this in mind, the measures will be out of control even while we perform
exactly to plan.
Lean Metric
Examples
|
Safety
Reportable Incidents
Days worked without a lost time accident
Ergonomic Management
|
People
Targeted Training Hours
Voluntary Turnover
Production to Skilled Trades Ratio
|
|
Quality
Delivered Quality
Rework / Repair Cost
Customer Complaints
|
Responsiveness
On Time Delivery
Manufacturing Lead Time
Inventory Turns
|
|
Financial
Margin $
Manufacturing Space Used
Conversion Cost (Labor $ / Unit)
|
|
Metrics fall into
two categories, results and drivers. Driver metrics can have a profound
impact on the performance of a business because they provide immediate
feedback on how a process is running. They facilitate immediate
improvement and provide a tool to allow managers to immediately change
the behaviors which are causing the issues. For example, a scrap metric
will provide the operations team data on which product lines are
producing the most scrap, allowing for direct intervention to drive
improvements. Financial metrics on the other hand are generally
results, as they report after the fact and are difficult to dissect to
determine causes.
Keep this in mind when designing the metrics. With slight changes to
the definition of the metrics, they can be changed from results to
drivers. While data based reporting systems have both result and driver
metrics, the most effective systems have a driver to results ratio of
4:1.
5. Plan Your Strategy
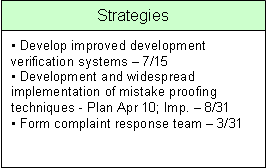 For each goal, establish at least one strategy
statement, describing the major process changes and improvement
efforts. Put some urgency behind the strategies by setting deadlines or
target dates for implementation. For each goal, establish at least one strategy
statement, describing the major process changes and improvement
efforts. Put some urgency behind the strategies by setting deadlines or
target dates for implementation.
A data based reporting system won’t improve your results. It is just a
tool which can make the difficult task of running a business a little
easier. The strategies that are deployed to drive the improvements
needed are how the actual gains are realized. Without a sound strategy
to make the changes required, it is unlikely that really significant
gains will be had or maintained in the long run.
6. Help for Getting Started
I have developed a template for the 4
Panel Approach which is available for download. You are free to use it,
but please make sure that you document this website as the source.
The next step in implementing your own data based reporting system are
discussed in detail in my white paper entitled “Establishing Lean Metrics – A Quick Start to your
Data Based Reporting System”. Return to this website soon to get a
copy.
Good Luck!
|